
Within the complex field of pharmaceutical development, visualisation and analysis of toxicological data is essential. Indeed, results obtained from a research, such as the ones deriving from the research work presented in the Innovamol’s paper “A non-clinical and clinical IUCLID database for 530 pharmaceuticals (part I): Methodological aspects of its development” can be better visualised and interpreted in the right way. In this article, it is presented the visualisation of a new IUCLID database, which includes information on severity and reversibility.
The database was created by extracting data from pharmacological reviews and connecting observed and not-observed effects to the appropriate effect levels. This database, complemented by a specific ontology for reporting effects, offers a robust dataset that facilitates correlation and concordance analyses. The database served as foundations for the creation of Innovamol’s Toxicity DataViz, which is an innovative platform designed to simplify and enhance the way researchers and regulators interact with complex datasets. The platform enables users easily navigate toxicological information by using graphical tools, so obtaining a clear and instantaneous overview of significant information. The platform’s simplify the interaction with this data, offering users a clear and instantaneous overview of the key numbers and effects derived directly from the IUCLID database, and guaranteeing that the platform is both user-friendly and rigorously scientific.
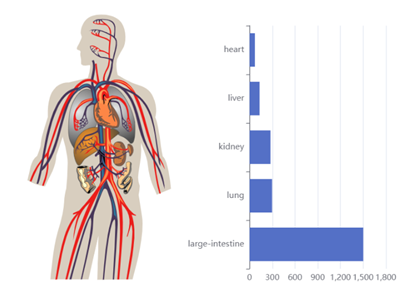
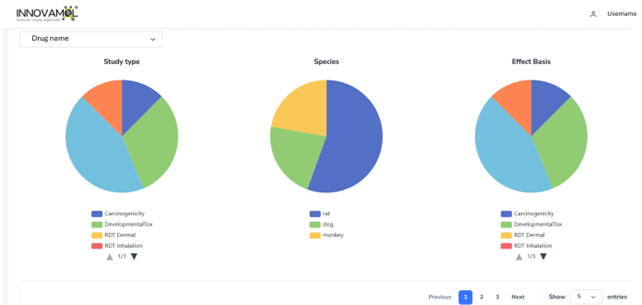
For instance, it includes intuitive bar graphs and tables that present molecular weight distribution and highlights the most common pharmacological classes across different pharmaceuticals. These tools make it easy to identify trendsand correlations within the dataset, offering a quick and effective way to assess drug characteristics. Additionally, the platform features detailed non-clinical data visualisations across several key dimensions, such as pharmacological study types, species distribution, and effect basis distribution. Pie charts illustrate the variety of study types and the prevalence of different animal models used in non-clinical studies, facilitating quick comparisons and in-depth analyses that aid researchers in drawing meaningful conclusions. Human data insights are also integrated into the platform, allowing users to correlate non-clinical findings with human outcomes, which is crucial for predicting potential human risks and improving the safety profiles of new pharmaceuticals.
Moreover, after logging in, users can access advanced features that go beyond basic information. The platform enables viewing descriptive statistics for each pharmaceutical selected from a dropdown menu.
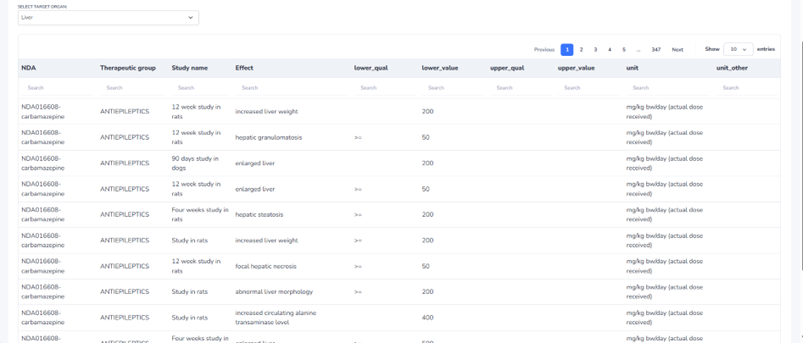
A standout feature is the ability to filter toxicity data by target system or organ, allowing users to focus on specific toxicities of interest. From there, users can further refine their analysis by filtering for specific drugs, therapeutic classes, or study types. This powerful filtering capability enhances the platform’s ability to facilitate meaningful comparisons and in-depth exploration of the dataset, making it easier to draw significant conclusions and insights.
Looking ahead, we plan to enhance the Toxicity DataViz platform, which is already accessible to users who sign up for a free account. This feature currently allows users to access important in-depth analyses and make comparisons across datasets. Future updates will further improve the platform, addressing gaps like the ontology section and potentially introducing features, such as access to the “Compare NDAs” page once it’s fully developed. These enhancements will meet the demands of researchers who need more sophisticated data manipulation tools and deeper insights.
Beyond just being a powerful visualisation tool, Toxicity DataViz plays a critical role in improving predictive toxicological models, such as QSARs (Quantitative Structure-Activity Relationships). By providing structured and comprehensive data, the platform helps researchers predict adverse effects with greater accuracy, reducing the risk of late-stage clinical trial failures. Additionally, the platform supports regulatory compliance by aligning with New Approach Methodologies (NAMs) and Integrated Approaches to Testing and Assessment (IATAs), making it a vital tool for risk assessment and regulatory decision-making.
Since Innovamol’s Toxicity DataViz combines sophisticated data organisation with intuitive visualisation capabilities, whether you are a researcher, pharmaceutical developer, or regulatory professional, this tool can provides the insights needed to make informed decisions and advance the safety and efficacy of new drugs or chemical.
Visit Toxicity DataViz to learn more about its capabilities!
“The greatest value of a picture is when it forces us to notice what we never expected to see” – John W. Tukey